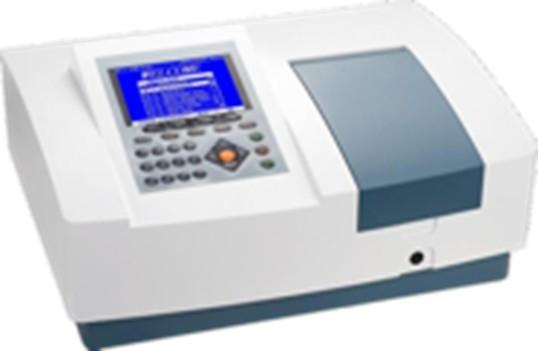
UV/VIS Spectrometer, Single beam, 190 - 1100 nm, 1 nm + Software
Rp123.00
Our UV/VIS Spectrometer with a 190–1100 nm wavelength range, single beam optics, and a 1 nm spectral bandwidth provides high-resolution data for a broad range of scientific applications combined with powerful PC software.
The included PC software expands the utility of the instrument for complex analyses beyond simple absorbance/transmittance measurements:
Spectrum Scanning: The software allows the instrument to scan the entire 190–1100 nm range, producing a complete absorption curve that helps identify unknown compounds or assess sample purity.
Kinetics (Time Scan): Monitor the rate of chemical or enzymatic reactions in real-time by measuring absorbance changes at a fixed wavelength over a period.
Quantitative Analysis: Create detailed standard curves using multiple standards and store hundreds of test data points and regression equations, which is crucial for precise concentration determination in pharmaceuticals and environmental testing.
DNA/Protein Analysis: Dedicated software modules assist in the standard quantification of DNA, RNA, and protein concentrations using specific wavelength ratios (e.g., A260/A280 ratios, which are possible with the UV range capability).
Data Management & Export: Data and curves can be saved to the instrument's memory or exported via the USB port to a computer for further processing and reporting, often directly to Excel format.
Applications:
1. Life Sciences & Molecular Biology
Because this model reaches into the Deep UV (190–300 nm), it is essential for:
DNA/RNA Quantification: Measuring absorbance at 260 nm to determine concentration and checking purity via the A260/A280 ratio.
Protein Analysis: Using the Warburg-Christian method at 280 nm or colorimetric assays (Bradford, Lowry) in the visible range.
Enzyme Kinetics: Precise monitoring of NADH/NAD+ reactions at 340 nm.
2. Pharmaceutical Research & Development
The 1 nm resolution meets the stringent requirements of Pharmacopoeia (USP/BP/EP):
Identification Tests: The high resolution ensures that the "fingerprint" spectrum of an Active Pharmaceutical Ingredient (API) matches the reference standard exactly.
Dissolution Testing: Analyzing how fast a drug is released from a tablet into a medium over time.
Stability Studies: Detecting minor degradation products that appear as small "shoulders" on a main spectral peak.
3. Advanced Environmental Monitoring
Complex Organic Pollutants: Identifying specific aromatic hydrocarbons (VOCs) in water that absorb in the 200–300 nm range.
Nitrate & Nitrite: Precise UV measurements for water quality assessment in municipal and industrial treatment plants.
4. Chemical Industry & Material Science
Purity Validation: Essential for detecting low-level impurities in high-purity solvents (e.g., HPLC grade acetonitrile).
Nanomaterials: Characterizing the optical properties and size distribution of gold or silver nanoparticles using Surface Plasmon Resonance (SPR) peaks.
5. Food & Beverage Safety
Olive Oil Grading: Measuring K-values (K232 and K270) in the UV range to detect oxidation and distinguish between extra virgin and refined oils.
Vitamin Analysis: Quantifying light-sensitive vitamins like A, C, and E in fortified foods.
Key Advantage of the 1 nm Bandwidth:
If you are working with benzene vapors or rare-earth elements, a 1 nm bandwidth allows you to see individual vibrational bands. A 4 nm bandwidth instrument would simply show one large, inaccurate "hump."